Goals:
- To prepare data for mapping (final step)
- Do simple mapping in
QGIS
Solutions to Text to Map 1/1
Collecting all toponyms
import re, os

source = "path/to/your/xml/files/"

topoDict = {}

def updateDic(dic, key):
    if key in dic:
        dic[key] += 1
    else:
        dic[key]  = 1

def collectTaggedToponyms(xmlText, dic):
    xmlText = re.sub("\s+", " ", xmlText)
    date = re.search(r'<date value="([\d-]+)"', xmlText).group(1)
    count1, count2 = 0,0
    for t in re.findall(r"<placeName[^<]+</placeName>", xmlText):
        t = t.lower()
        if 'tgn,' in t:
            if re.search(r'reg="([^"]+)"', t):
                reg = re.search(r'reg="([^"]+)"', t).group(1)
            else:
                #print(t)
                reg = 0

            if re.search(r'key="([^"]+)"', t):
                key = re.search(r'key="([^"]+)"', t).group(1)
            else:
                #print(t)
                key = 0

            if reg == 0 or key == 0:
                count1 += 1
            else:
                count2 += 1
                keyNew = reg+"\t"+key
                updateDic(topoDict, keyNew)
##    if count1 >= 0:
##        print("%s: %d out of %d toponyms misstagged." % (date, count1, count2))


def collectRawToponyms(source):
    lof = os.listdir(source)
    lof = sorted(lof, reverse=False)
    counter = 0

    for f in lof:
        if f.startswith("dltext"): # fileName test
            with open(source + f, "r", encoding="utf8") as f1:
                text = f1.read()
                collectTaggedToponyms(text, topoDict)

    freqList = []
    thresh = 100
    for k,v in topoDict.items():
        if v >= thresh:
            freqList.append("%09d\t%s" % (v,k))
    print("Number of unique items with freq at least %d: %d" % (thresh, len(freqList)))

    # Number of unique items with freq at least 1: 9246
    # Number of unique items with freq at least 2: 5388
    # Number of unique items with freq at least 3: 4062
    # Number of unique items with freq at least 4: 3344
    # Number of unique items with freq at least 5: 2932

    freqList = "\n".join(sorted(freqList, reverse=True))
    with open("freqList.csv", "w", encoding="utf8") as f9:
        f9.write(freqList)


collectRawToponyms(source)
Results
NB: \t are replaced with ` » ` for readability
000033872 >> richmond, richmond, virginia >> tgn,7013964
000019113 >> united states >> tgn,7012149
000011045 >> virginia, united states, north and central america >> tgn,7007919
000008934 >> washington, district of columbia, united states >> tgn,7013962
000006926 >> charleston, charleston, south carolina >> tgn,7013582
000006537 >> united kingdom >> tgn,7002445
000006387 >> virginia >> tgn,7007919
000004064 >> kentucky >> tgn,7007255
000004063 >> baltimore, baltimore independent city, maryland >> tgn,7013352
000004062 >> petersburg, petersburg, virginia >> tgn,7014404
...
Load and Match
import re, os

def loadGeoData(fileName):
    dic = {}

    with open(fileName, "r", encoding="utf8") as f1:
        data = f1.read().split("\n")

        for d in data:
            d1 = d.split("\t")

            if len(d1) == 19:

                val = "\t".join([d1[1]+", "+d1[10], d1[4], d1[5]])
                test = d1[1].lower()

                if test in dic:
                    dic[test].append(val)
                else:
                    dic[test] = [val]

    return(dic)

geoDataFile = "./US/US.csv"
geoData = loadGeoData(geoDataFile)

def processResults(fileName):
    with open(fileName, "r", encoding="utf8") as f1:
        data = f1.read().split("\n")

        newData = []

        noResult = "\t".join(["NA", "NA", "NA"])

        for d in data:
            d1 = d.split("\t")

            if "," in d1[1]:
                test = d1[1].split(",")[0]
            else:
                test = d1[1]

            if test in geoData:
                for i in geoData[test]:
                    newData.append(d+"\t"+i)
            else:
                newData.append(d+"\t"+noResult)

    with open("matchedResults.csv", "w", encoding="utf8") as f9:
        f9.write("\n".join(newData))

processResults("freqList.csv")
Some data comprehension (from the readme file)
The main 'geoname' table has the following fields :
---------------------------------------------------
0  geonameid         : integer id of record in geonames database
1  name              : name of geographical point (utf8) varchar(200)
2  asciiname         : name of geographical point in plain ascii ...
3  alternatenames    : alternatenames, comma separated, ascii ...
4  latitude          : latitude in decimal degrees (wgs84)
5  longitude         : longitude in decimal degrees (wgs84)
6  feature class     : see http://www.geonames.org/export/codes.html, char(1)
7  feature code      : see http://www.geonames.org/export/codes.html, varchar(10)
8  country code      : ISO-3166 2-letter country code, 2 characters
9  cc2               : alternate country codes, comma separated, ...
10 admin1 code       : fipscode (subject to change to iso code), ...
11 admin2 code       : code for the second administrative division, ...
12 admin3 code       : code for third level administrative division, varchar(20)
13 admin4 code       : code for fourth level administrative division, varchar(20)
14 population        : bigint (8 byte int)
15 elevation         : in meters, integer
16 dem               : digital elevation model, srtm3 or gtopo30, ...
17 timezone          : the iana timezone id (see file timeZone.txt) varchar(40)
18 modification date : date of last modification in yyyy-MM-dd format
Results
NB: \t are replaced with ` » ` for readability
...
000004063 >> baltimore, baltimore independent city, maryland >> tgn,7013352 >> Baltimore, KY >> 36.68756 >> -88.80589
000004063 >> baltimore, baltimore independent city, maryland >> tgn,7013352 >> Baltimore, MD >> 39.29038 >> -76.61219
000004063 >> baltimore, baltimore independent city, maryland >> tgn,7013352 >> Baltimore, NC >> 34.43656 >> -78.44028
000004063 >> baltimore, baltimore independent city, maryland >> tgn,7013352 >> Baltimore, NC >> 35.95847 >> -80.45783
000004063 >> baltimore, baltimore independent city, maryland >> tgn,7013352 >> Baltimore, NC >> 36.14792 >> -80.52978
000004063 >> baltimore, baltimore independent city, maryland >> tgn,7013352 >> Baltimore, OH >> 39.84534 >> -82.60072
000004063 >> baltimore, baltimore independent city, maryland >> tgn,7013352 >> Baltimore, TN >> 35.98427 >> -83.05932
000004063 >> baltimore, baltimore independent city, maryland >> tgn,7013352 >> Baltimore, NY >> 42.73535 >> -76.12576
000004063 >> baltimore, baltimore independent city, maryland >> tgn,7013352 >> Baltimore, VT >> 43.36035 >> -72.57315
...
Processing results: selecting only needed matches
000004063 >> baltimore, baltimore independent city, maryland >> tgn,7013352 >> Baltimore, KY >> n >> 36.68756 >> -88.80589
000004063 >> baltimore, baltimore independent city, maryland >> tgn,7013352 >> Baltimore, MD >> y >> 39.29038 >> -76.61219
000004063 >> baltimore, baltimore independent city, maryland >> tgn,7013352 >> Baltimore, NC >> n >> 34.43656 >> -78.44028
000004063 >> baltimore, baltimore independent city, maryland >> tgn,7013352 >> Baltimore, NC >> n >> 35.95847 >> -80.45783
000004063 >> baltimore, baltimore independent city, maryland >> tgn,7013352 >> Baltimore, NC >> n >> 36.14792 >> -80.52978
000004063 >> baltimore, baltimore independent city, maryland >> tgn,7013352 >> Baltimore, OH >> n >> 39.84534 >> -82.60072
000004063 >> baltimore, baltimore independent city, maryland >> tgn,7013352 >> Baltimore, TN >> n >> 35.98427 >> -83.05932
000004063 >> baltimore, baltimore independent city, maryland >> tgn,7013352 >> Baltimore, NY >> n >> 42.73535 >> -76.12576
000004063 >> baltimore, baltimore independent city, maryland >> tgn,7013352 >> Baltimore, VT >> n >> 43.36035 >> -72.57315
Generating Mappable Data
import re, os

source = "/path/to/your/xml/files/"

topoDict = {}
def updateDic(dic, key):
    if key in dic:
        dic[key] += 1
    else:
        dic[key]  = 1

def loadMapLayer(fileName):
    dic = {}

    with open(fileName, "r", encoding="utf8") as f1:
        data = f1.read().split("\n")

        for d in data:
            d1 = d.split("\t")
            if d1[4] == "y":
                key = d1[2]
                val = "\t".join([d1[3], d1[5], d1[6]])
                dic[key] = val

    return(dic)

mapData = loadMapLayer("matchedResults_curated.csv")

def collectTaggedToponyms(xmlText, dic, dateFilter):
    xmlText = re.sub("\s+", " ", xmlText)
    date = re.search(r'<date value="([\d-]+)"', xmlText).group(1)

    for t in re.findall(r"<placeName[^<]+</placeName>", xmlText):
        t = t.lower()

        if re.search(r'"(tgn,\d+)', t):
            reg = re.search(r'"(tgn,\d+)', t).group(1)

            if reg in mapData:
                updateDic(topoDict, mapData[reg])

def collectMappableLayers(source, dateTest):
    lof = os.listdir(source)
    lof = sorted(lof, reverse=False)
    counter = 0

    for f in lof:
        if f.startswith("dltext"): # fileName test
            with open(source + f, "r", encoding="utf8") as f1:
                text = f1.read()

                # date filter
                date = re.search(r'<date value="([\d-]+)"', text).group(1)
                if date.startswith(dateTest):
                    collectTaggedToponyms(text, topoDict, dateTest)

    freqList = []
    thresh = 1
    for k,v in topoDict.items():
        if v >= thresh:
            freqList.append("%09d\t%s\t%d" % (v,k, v//20))

    freqList = "\n".join(sorted(freqList, reverse=True))
    with open("Dispatch_Geo_%s.csv" % dateTest, "w", encoding="utf8") as f9:
        f9.write(freqList)


collectMappableLayers(source, "1863")

# Task: generate files for all years, all months, and all days
# - you can save results in subfolders;
# - or, better, in single files with dates in another column
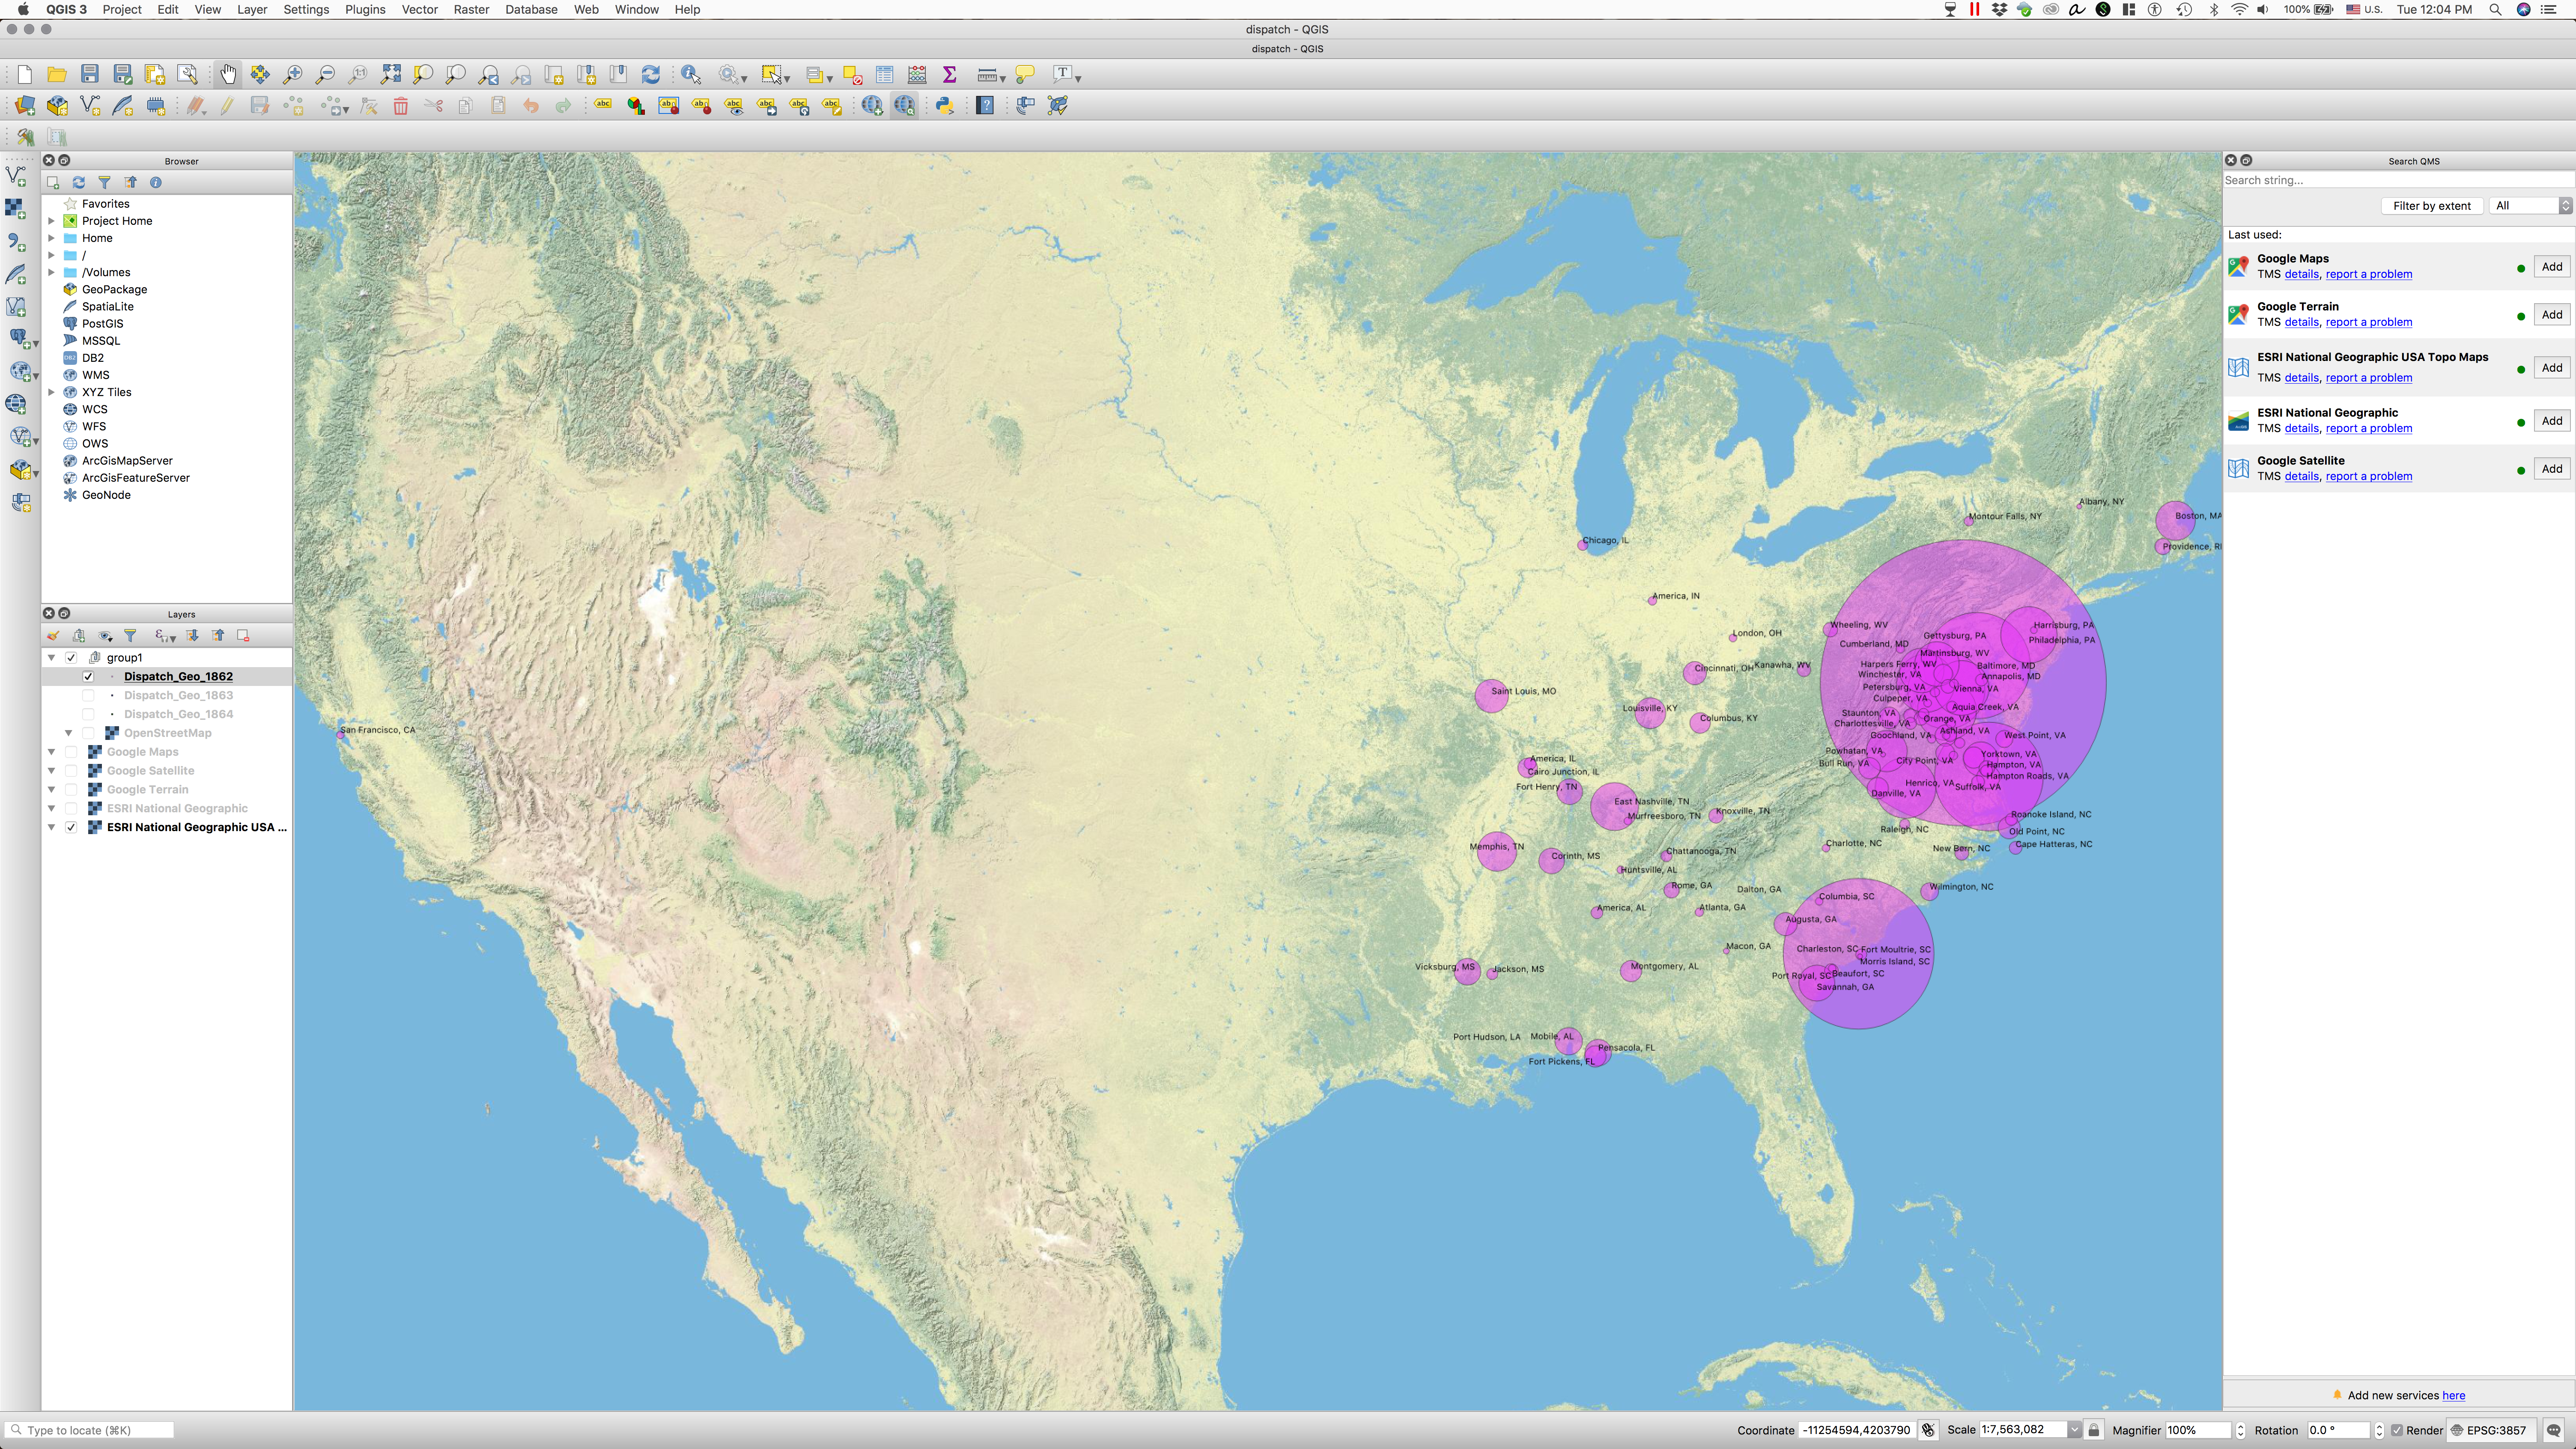
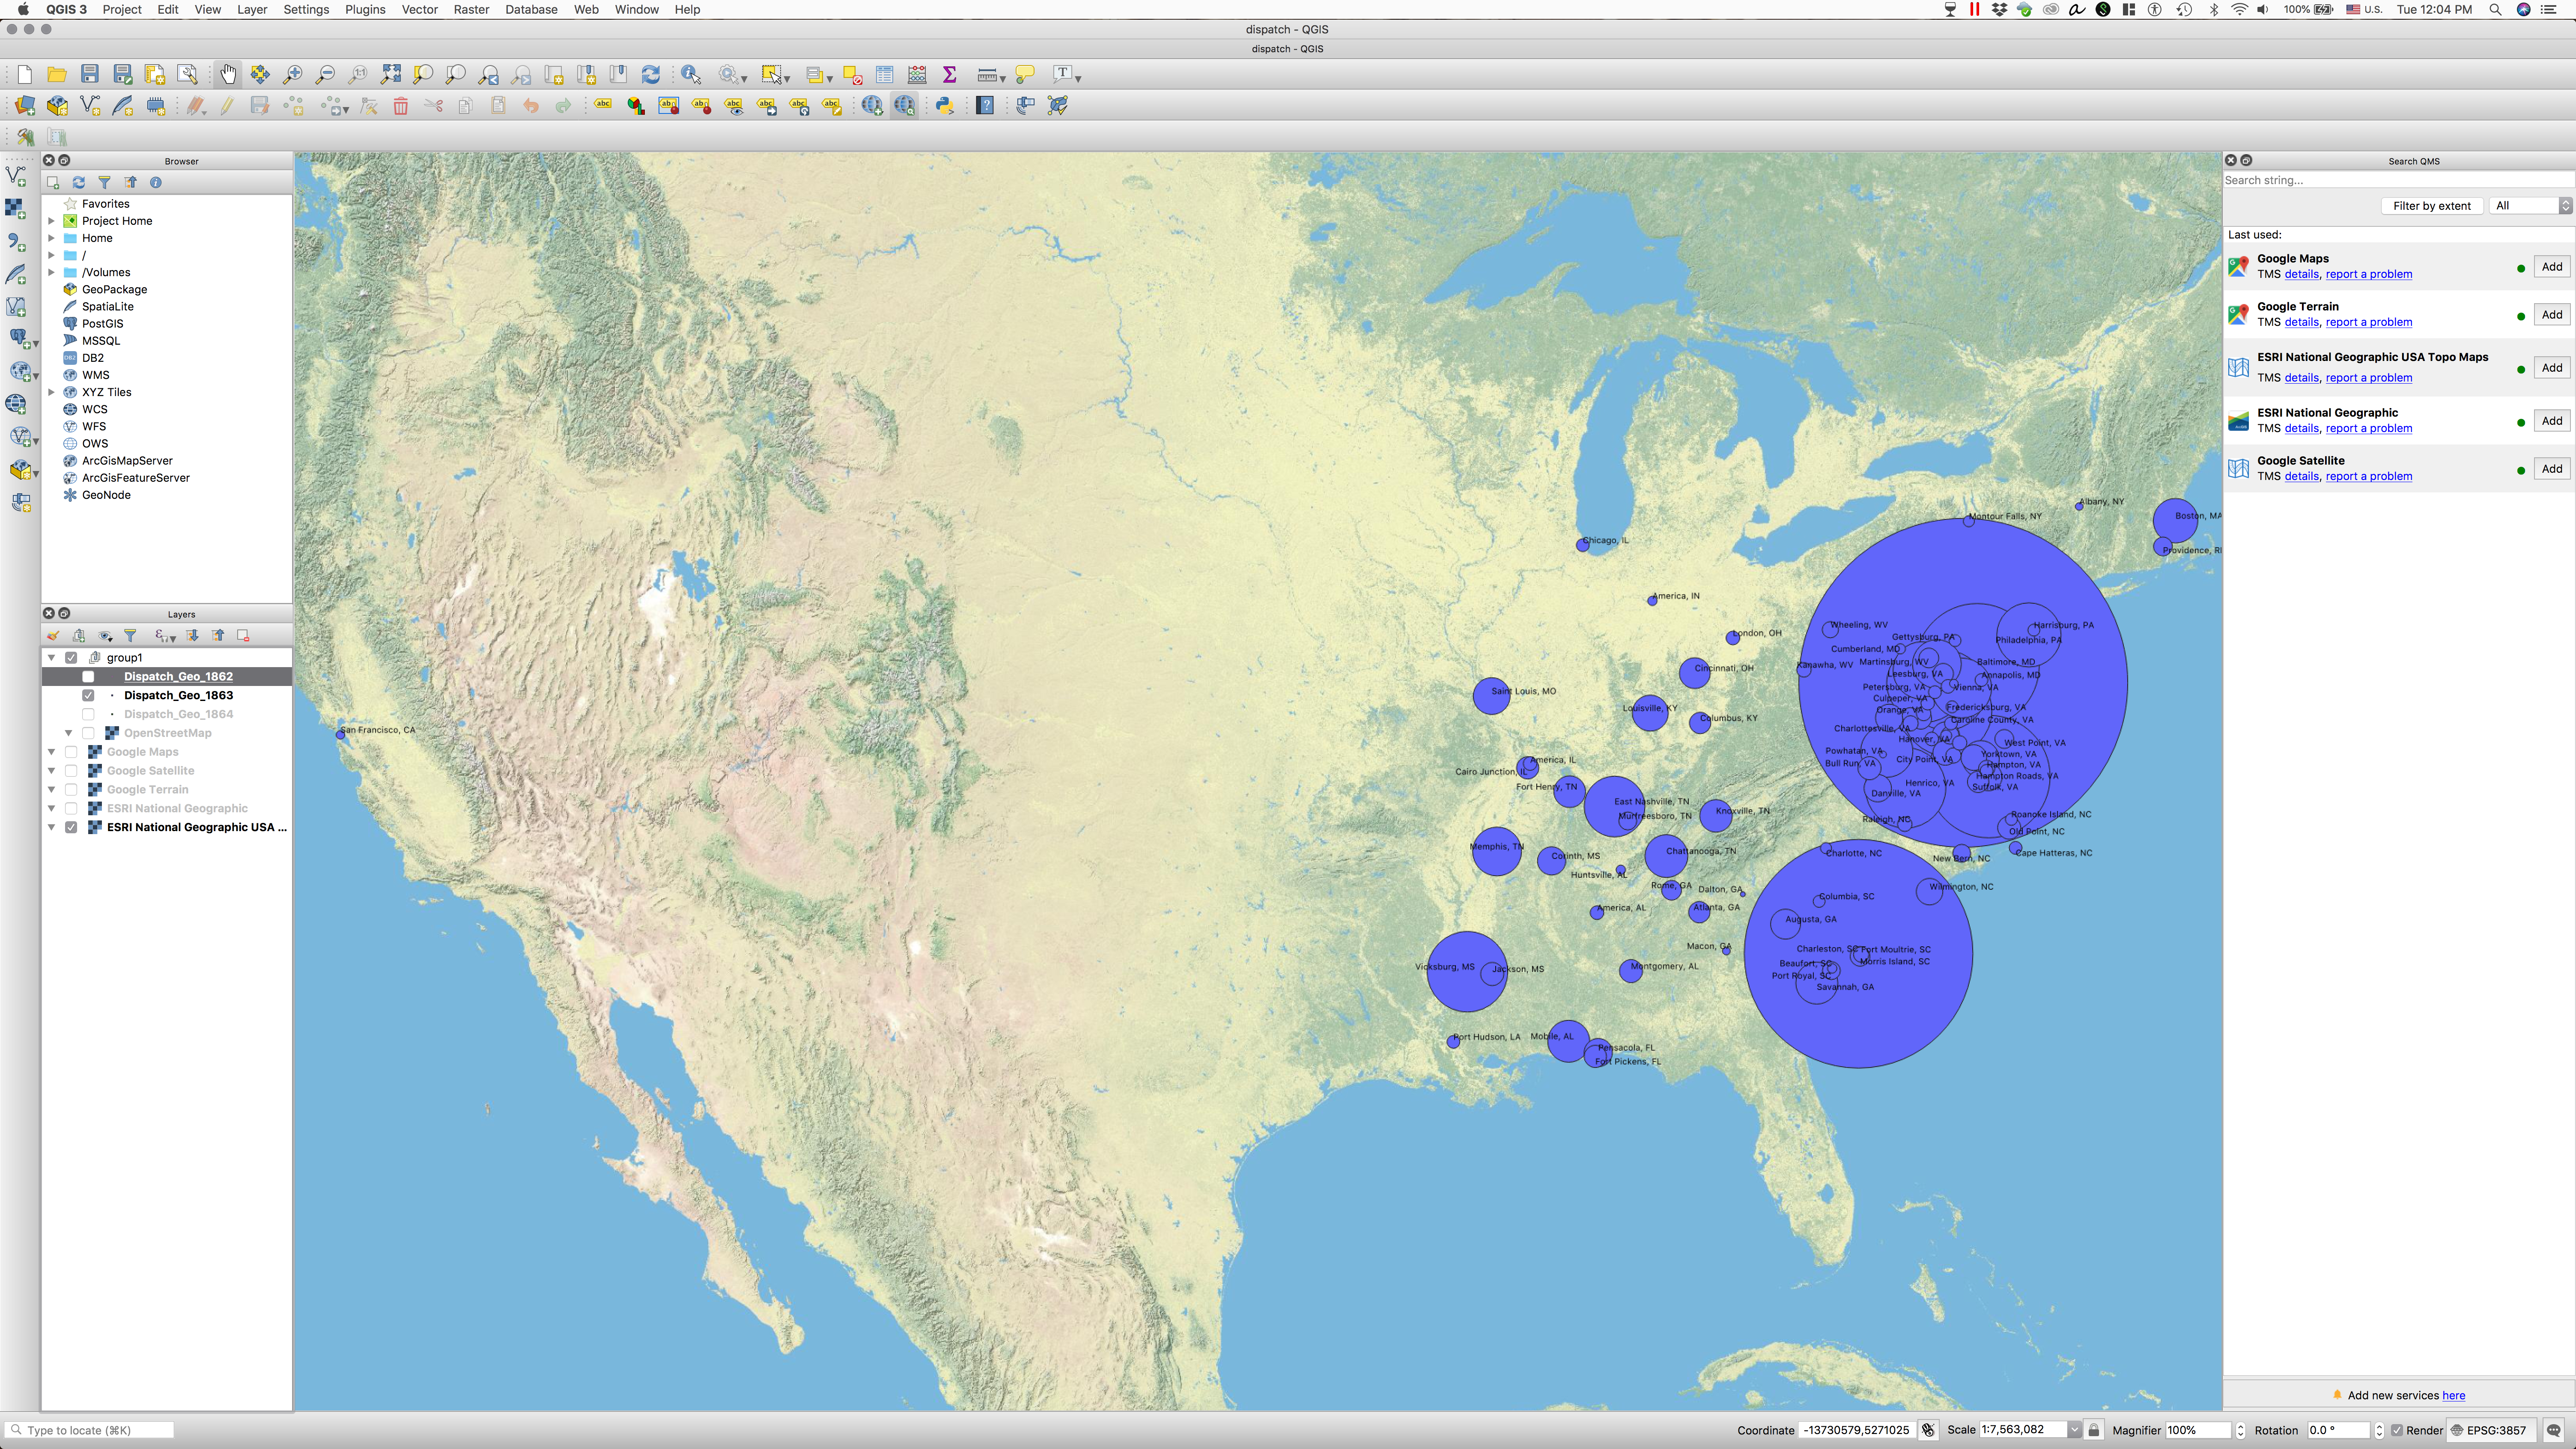
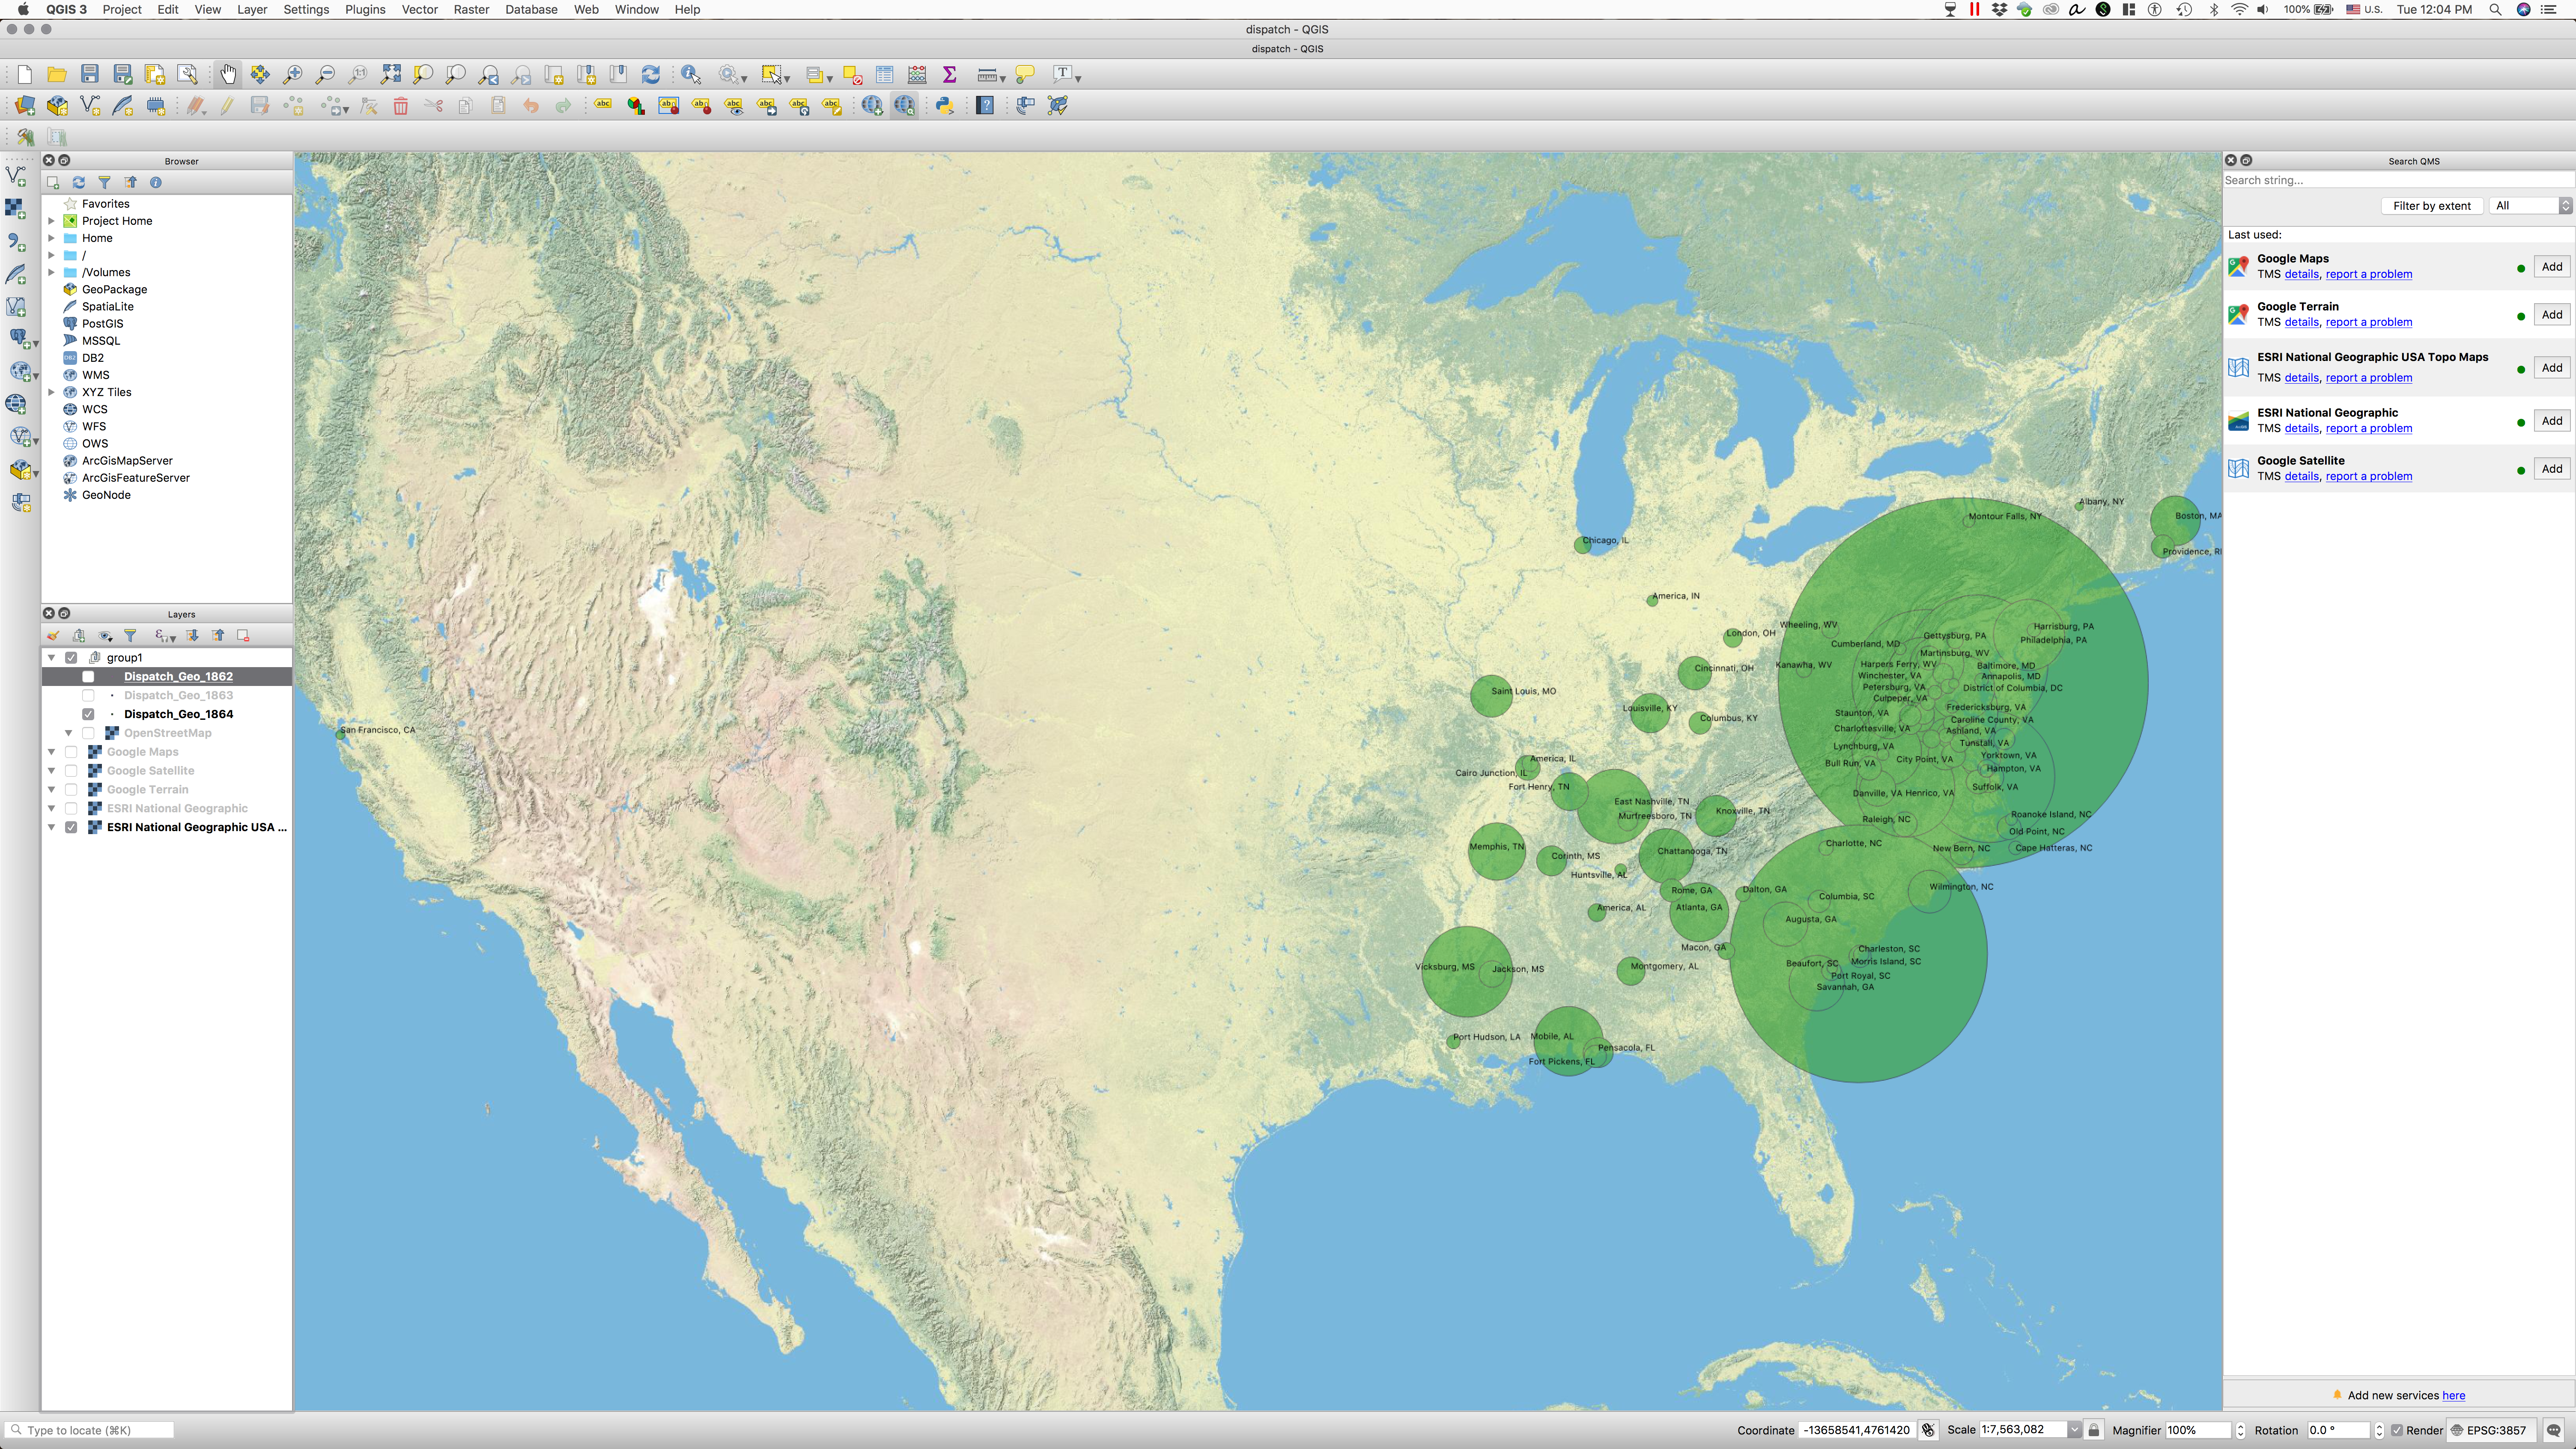
Maps in QGIS
NB: In general, the following brief instructions should suffice; if you are confused, google it, or/and ask your comrades for help.
- In QGIS:
- Layer >
- Add Layer >
- Add Delimited Text Layer (need to point which columns are coordinates!)
- Style your layer (size of circles, transparency, labels, etc.)
- In QGIS:
- Use
QuickMapServices (QMS)plugin to add a map layer quickly.
- Use
- In QGIS:
- You can use
TimeManagerplugin to animate your maps over time.
- You can use
Results


Reference Materials:
- Frequency list: Turkel, William J., and Adam Crymble. 2012. “Counting Word Frequencies with Python.” Programming Historian, July. https://programminghistorian.org/lessons/counting-frequencies.
- Creating cartograms with R: https://maximromanov.github.io/2015/04-02.html
Homework (1/2 and 2/2):
- GISting the “Dispatch” II: Mapping geographical data from the “Dispatch”
- Extract toponyms (place names) from the “Dispatch” (python)
- Calculate their frequencies (python)
- Generate files for all years, all months, and all days (you can save results in subfolders, but, better, in single files with dates in another column)
- Add coordinates to those places (QGIS/python)
- Hint: you can create two lists 1) one with place names and their frequencies, 2) with place names and their coordinates; after that, you can merge them with python and generate a CSV file (placename, timeParameter, latitude, longitude, frequency) which can be used for creating a map in QGIS
- Map them in QGIS, using frequencies to size the markers on the map
- Describe the process in a blogpost and publish on your website (including screenshots).
- since you are provided with almost complete solutions here, you should do the following:
- describe every line of code
- provide alternative code (to the whole or parts), explain why you think yours is better
- try to find errors, inefficiencies, or/and flaws in the offered solutions—this will give you extra points.
- since you are provided with almost complete solutions here, you should do the following: